Tour De Frank - Lands End to John O’Groats July 2002
“Analysis of Long Distance Pedaling -
A Case Study using an Intrepid Statistically Minded Scotsman”
by N.J. Douglas, Unpublished Working Note #763.
1 The Data:
|
Day |
Day Of Week |
Date |
Section Name |
Distance km |
Cum Distance km |
Hrs in Saddle |
Cum Hrs In Saddle |
Av Speed km/h |
Max Speed km/h |
|
1 |
Sat |
29 June |
Penzance |
15:29 |
15:29 |
0:40 |
0:40 |
22.54 |
52 |
|
2 |
Sun |
30 June |
Golant |
108.19 |
123.48 |
6:32 |
7:12 |
16.56 |
34 |
|
3 |
Mon |
1 July |
Moretonhampstead |
101.67 |
225.15 |
6:13 |
13:25 |
16.35 |
63 |
|
4 |
Tue |
2 July |
Cheddar |
126.78 |
351.93 |
6:36 |
20:01 |
19.18 |
54 |
|
5 |
Wed |
3 July |
Chepstow |
90.9 |
442.83 |
5:32 |
25:33:00 |
16.44 |
49 |
|
6 |
Thu |
4 July |
Clun |
128.42 |
571.25 |
7:00 |
32:33:00 |
18.33 |
59 |
|
7 |
Fri |
5 July |
Liverpool |
154.46 |
725.71 |
7:54 |
40:27:00 |
19.57 |
53 |
|
8 |
Sat |
6 July |
Carnforth |
130.09 |
855.8 |
6:54 |
47:21:00 |
18.83 |
54 |
|
9 |
Sun |
7 July |
Lockerbie |
153:15 |
1,008.95 |
7:44 |
55:05:00 |
19:81 |
60 |
|
10 |
Mon |
8 July |
Glasgow |
136 |
1,144.95 |
7:13 |
62:18:00 |
18.85 |
51 |
|
11 |
Wed |
10 July |
Killin |
116.7 |
1,261.65 |
7:03 |
69:21:00 |
16.53 |
54 |
|
12 |
Thu |
11 July |
Aviemore |
128.28 |
1,389.93 |
6:57 |
76:18:00 |
18.46 |
51 |
|
13 |
Fri |
12 July |
Cromarty |
99.29 |
1,489.22 |
4:58 |
81:16:00 |
19.99 |
50 |
|
14 |
Sat |
13 July |
Bettyhill |
146.21 |
1,635.43 |
7:02 |
88:18:00 |
20.77 |
51 |
|
15 |
Sun |
14 July |
JOG |
87.66 |
1,723.09 |
4:42 |
93:00:00 |
18.62 |
50 |
|
Average |
115 |
- |
6.2 |
- |
18.7 |
52.3 |
|||
|
Standard Dev. |
35 |
- |
1.8 |
- |
1.8 |
6.5 |
2 Comments:
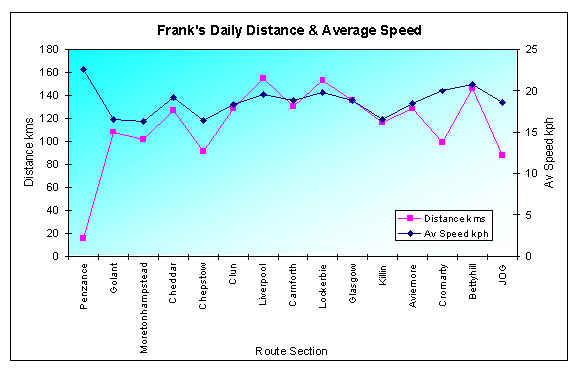
Frank averaged 115 km per day (i.e. excluding his day off). Good as this is, Frank’s warm up day in Penzance cost him seven kilometres per day from his daily mean. Excluding this ‘lazy’ first day makes Frank’s stats much more impressive with a daily average of 122 km.
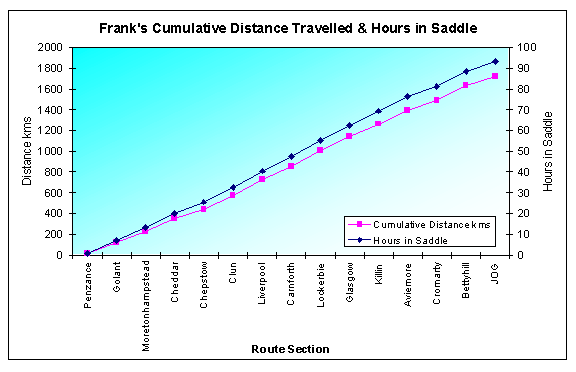
Hours in the saddle averaged 6.2 per day with the longest day being Day 9 Lockerbie with 7 hours 44 min pedaling. Did the beckoning of his home country, Belhaven heavy and Black Douglas whisky put an extra wee dram of effort into the pedaling?
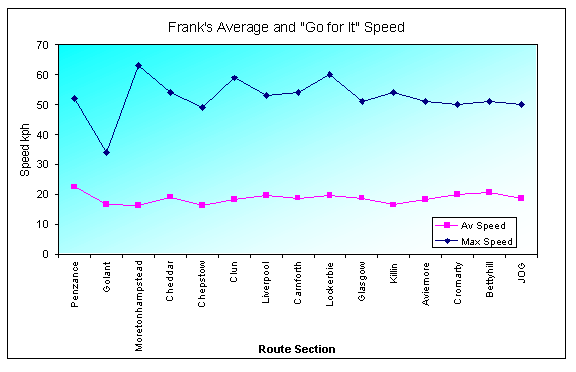
Frank averaged 18.7 km/h over the tour. Frank’s highest, 22.5 km/h was on his warm up day. Apparently Frank had already done the route in reverse so he knew where all the tight corners were to shave off some seconds. The slowest days were 3 and 5 where terrain, wind and two long bridges came into play. The average speeds were 16.35 km/h and 16.44 km/h for Moretonhampstead and Chepstow respectively. Day 2 Golant was the only other day when average speed was under 17 km/h. Otherwise 18.5km/h to 20 km/h was the norm. Possibly helped by flat terrain and improving fitness, Bettyhill Day 14 was the most impressive with 146 km covered at an average speed of 20.77km/h.
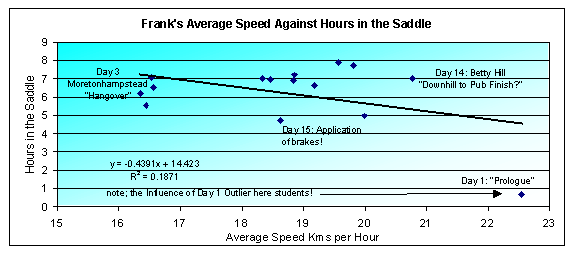
As you can see from the last graph, there was a weak relationship between distance and average speed. The longer Frank was in the saddle the less he did on average. However, it must be noted that Day 1 is a statistical outlier.
Although Moretonhampstead had the slowest average speed, it had the highest maximum speed. Terrain was the big factor with a long straight downhill section enabling Frank to put his head down and get his odometer up –up to 63 km/h in fact. This is where the adrenaline junkies should head to get those speed thrills and flashing blue lights?
The more cautious cyclist should head to Golant where Frank’s data suggests you can fall asleep in the saddle. Frank only got up to a maximum of 34 km/h and dawdled along at an average of 16.6 km/h.
For those more interested in variability (assessed in terms of the ratio of the standard deviation to the mean, or coefficient of variation for the jargon orientated) the greatest variability was in distance (CoV of 0.3) closely followed by travel time (CoV of 0.29). The CoV of maximum speed however was much lower at 0.12, and average speed was less variable still at 0.1. So Frank roughly pedals at the same rate although he goes a bit faster if he cuts down the distance. The distance Frank decides to do and the time he sits in the saddle are less easy to predict however. Maybe it just depends on where the next decent pub is for an evening session?
3 The Graphs: